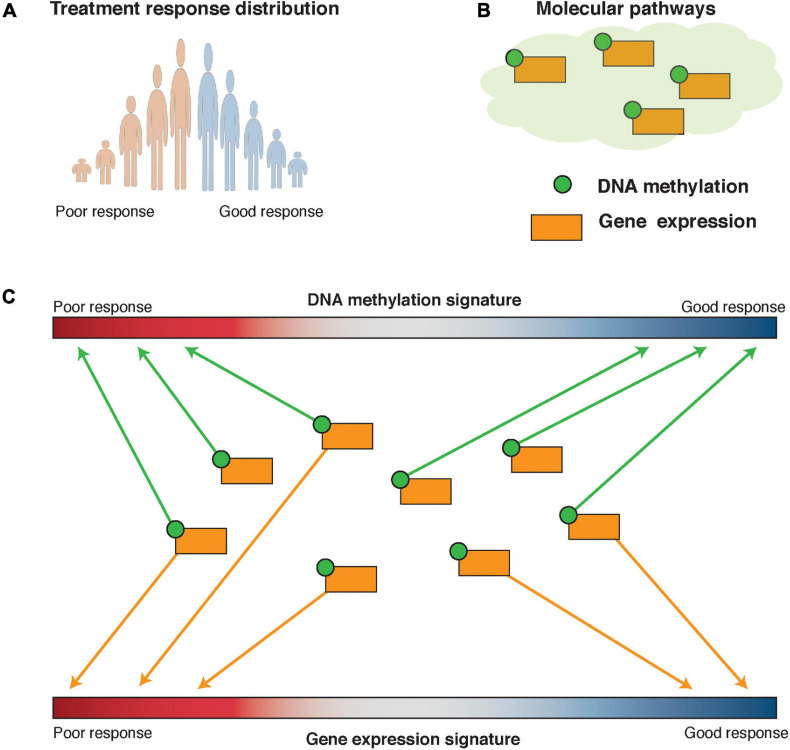
FIGURE 6.
Pathway-based modeling: pathCHEMO and pathER. (A) Therapeutic response distribution is defined based on time to therapeutic failure. Tails of this distribution are utilized in pathCHEMO and a full spectrum of therapeutic responses is utilized in pathER. (B) Molecular pathways are utilized as a knowledge base in pathway-based modeling. Genes in such pathways can be affected on multiple levels, such as differential expression (i.e., orange square) and DNA methylation (i.e., green satellite). (C) Molecular pathways are assessed for their integrated enrichment and association with therapeutic response.

