Fig. 2.

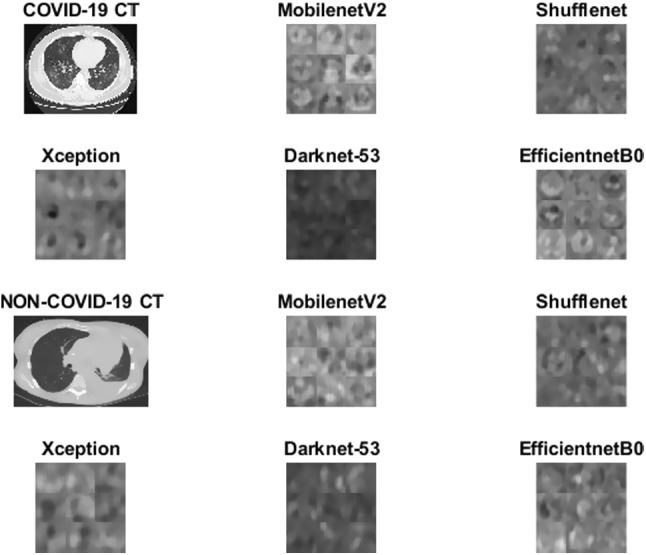
Sample features. Two rows at the top represent sample features of a COVID-19 image, and the two rows at the bottom represent sample features of a non-COVID-19 CT image

Sample features. Two rows at the top represent sample features of a COVID-19 image, and the two rows at the bottom represent sample features of a non-COVID-19 CT image