Fig. 3.

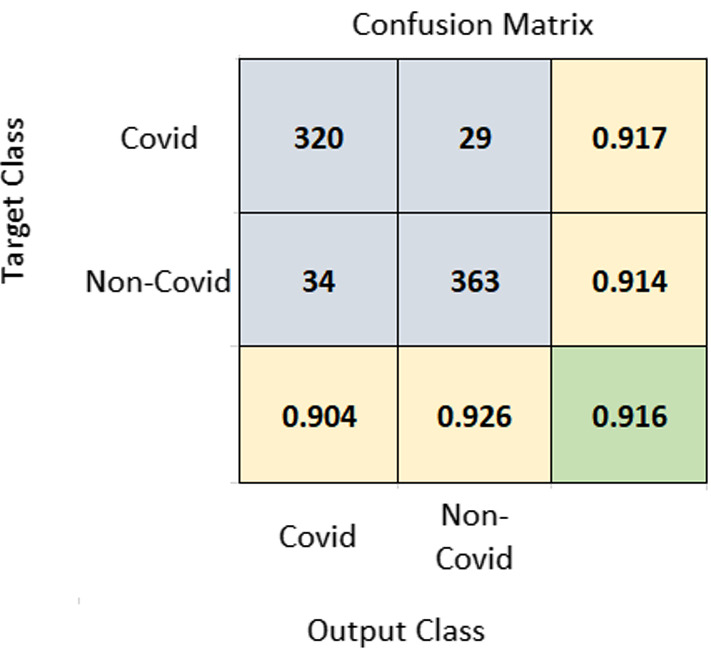
Confusion matrix of COVID-19 vs. non-COVID-19 classification. The diagonal element at the bottom shown in green color corresponds to accuracy. Rightmost column values represent sensitivity and bottom-most row elements represent PPV

Confusion matrix of COVID-19 vs. non-COVID-19 classification. The diagonal element at the bottom shown in green color corresponds to accuracy. Rightmost column values represent sensitivity and bottom-most row elements represent PPV