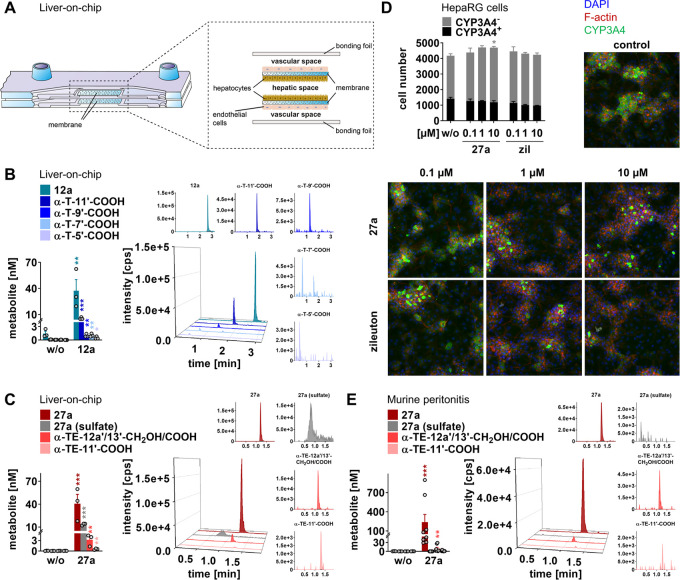
Figure 5.
Metabolism of 27a in a human liver-on-chip and in mice. (A) Scheme of the human liver-on-chip model. (B, C) The liver-on-chip was loaded with compound (1 μM) and incubated for 48 h. Extracted chromatograms (representative of three independent experiments) and concentrations of 12a and metabolites (B) or 27a and metabolites (C). (D) Effect of 27a and zileuton (zil) on CYP3A4 expression in differentiated HepaRG cells after treatment for 48 h. Fluorescence images (20× magnification) visualize CYP3A4-expressing (CYP3A4+) and CYP3A4-nonexpressing cells (CYP3A4–) and are representative of nine (w/o) or three independent experiments. (E) Extracted chromatograms (representative of eight mice) and concentrations of 27a and metabolites in plasma of mice with acute peritonitis 90 min post 27a administration (10 mg/kg, p.o.). Data are expressed as mean ± SEM (D) and single values (B, C, E) from n = 3 (B, C, D, 27a, and zil, E, w/o), n = 8 (E, 27a), and n = 9 (D, w/o) independent experiments. *p < 0.05, **p < 0.01, ***p < 0.001 vs control; two-tailed unpaired t-test of log data (B, C, E), ordinary one-way ANOVA + Tukey’s post hoc test (D). The nomenclature used for LCMs is explained in Table S2.

