
Figure 1.
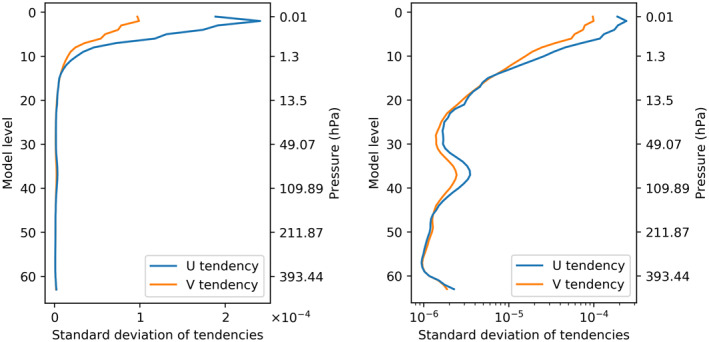
Standard deviation of the u and v wind tendencies from the high complexity NOGWD scheme (using the first 30 days of the data set), plotted on linear (left) and semilogarithmic (right) axes as a function of model level, plotting on the model levels where the scheme is activated. Velocity tendencies are largest at the top of the atmosphere (∼0.01 hPa), with a second peak around the 30th model level (∼70 hPa).