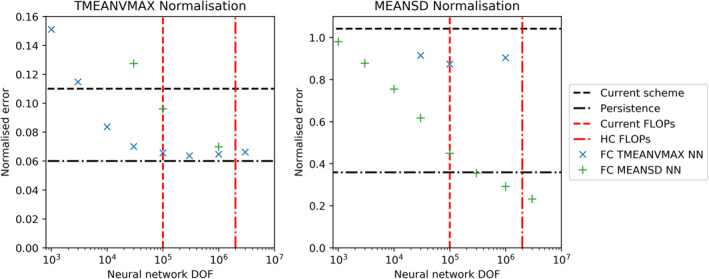
Figure 2.

Offline root‐mean‐squared error of the best performing network for a range of prescribed degrees of freedoms. Networks are trained and tested on data using two normalization methods, dubbed MEANSD and TMEANVMAX. For each normalization plot, we plot models that were trained using both normalization methods (not all models are plotted on each plot). To contextualize the offline results, we plot two baselines. First, the error of the current scheme relative to the high complexity (HC) scheme (which was used to generate the training data). Second, the error when persisting the HC scheme tendencies for the following time step. A vertical red line denotes the approximate floating‐point operations cost of the current scheme.
