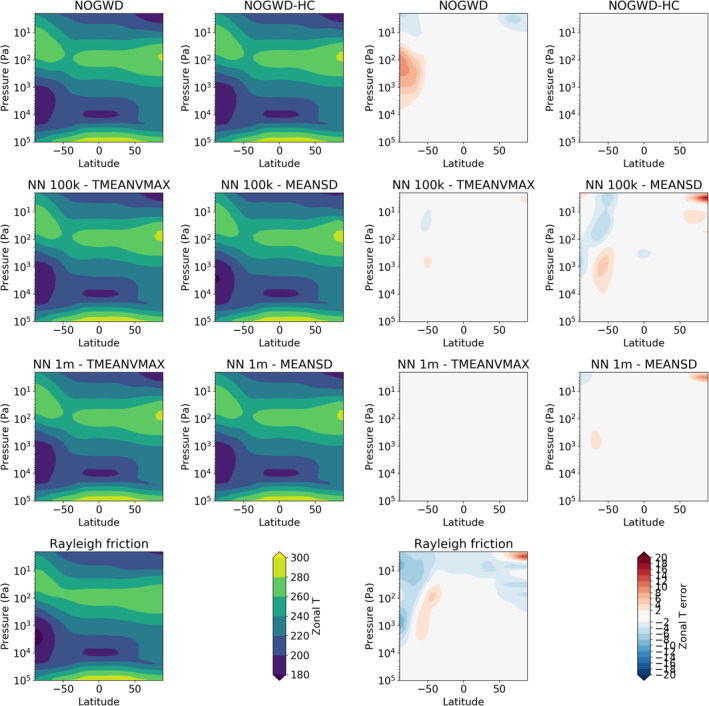
Figure 9.

June‐July‐August average temperature profiles. Left plots show the temperature profiles and right plots show the deviations from the NOGWD high‐complexity result. Each scheme produces very similar temperature profile to our reference simulation. The MEANSD models have a small warm bias over the Arctic.
