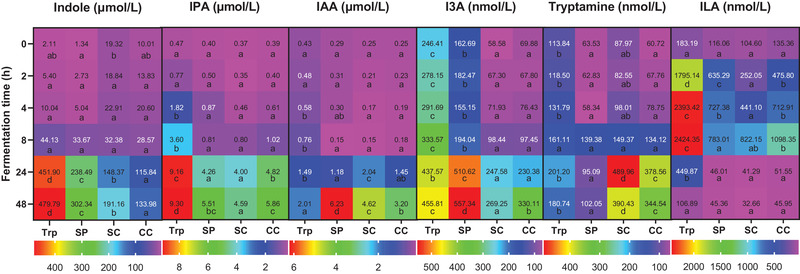
Figure 3.

Heatmap of tryptophan‐derived catabolites in supernatants collected during fermentation. Trp, fermented with tryptophan; SP, fermented with isolated soybean protein; SC, fermented with single soybean cells; CC, fermented with clustered soybean cells . Each catabolite has its own legend and corresponding concentrations are normalized by control samples fermented without supplied substrates and presented as the average of three independent replicates. Blocks with different lowercase letters in a row indicate treatments that are significantly different (p < 0.05, two‐way ANOVA followed by a Tukey post‐hoc test).
