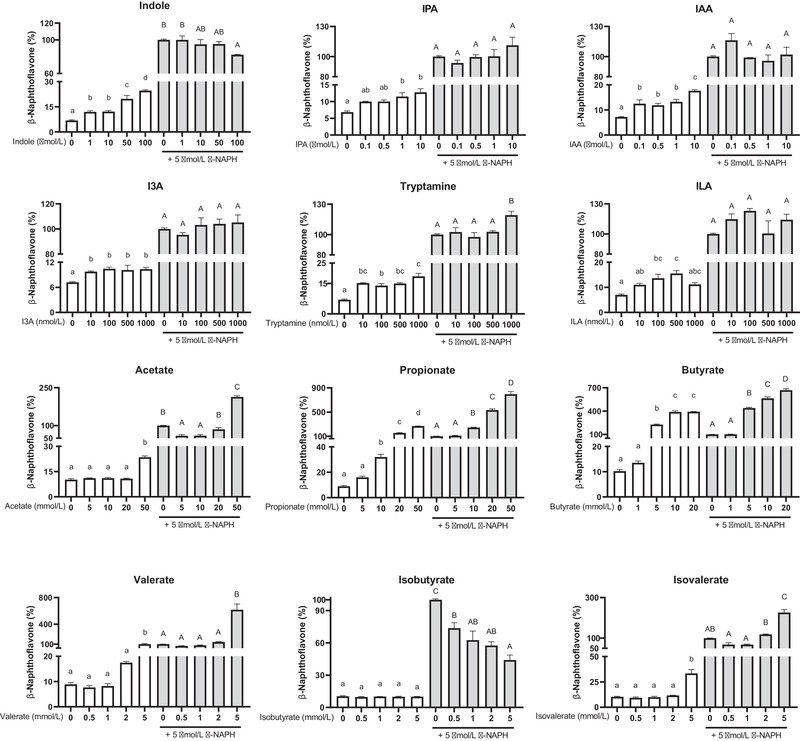
Figure 6.

Quantification of the AhR activity of SCFAs and tryptophan‐derived catabolites using the cell reporter assay. HepG2‐Lucia AhR reporter cells were incubated for 48 h with vehicle (medium or 1% v/v DMSO) and increasing concentrations of SCFAs or tryptophan‐derived catabolites, in the absence (white bars) or the presence (gray bars) of β‐NAPH (β‐naphthoflavone; 5 µmol L−1). Results are expressed as mean ± SEM (n = 3). Bars with different lowercase or uppercase letters indicate treatments that are significantly different (p < 0.05, one‐way ANOVA followed by a Tukey post‐hoc test).
