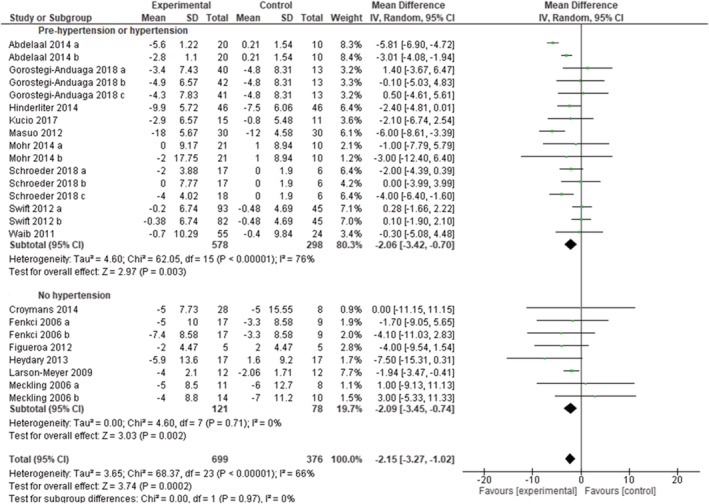
FIGURE 3.

Forest plot of the effect of exercise training versus control on diastolic blood pressure in adults with overweight or obesity, grouped by presence/absence of arterial hypertension. Presents mean difference between subjects participating in exercise training versus control in change of diastolic blood pressure. Articles are presented in alphabetical order. Subgroup “Normotensive patients” includes randomized controlled trials (RCTs) that excluded patients with overweight or obesity and hypertension. Subgroup “Pre‐hypertension or hypertension” includes RCTs that included only patients with overweight or obesity and prehypertension or hypertension. Abdelaal 2014 (a): Aerobic exercise; Abdelaal 2014 (b): resistance exercise. Fenkci (a): aerobic training; Fenkci (b): resistance training; Gorostegi‐Anduaga 2018 (a): high volume‐moderate intensity continuous training; Gorostegi‐Anduaga 2018 (b): high volume‐high intensity interval training; Gorostegi‐Anduaga 2018 (c): low volume‐high intensity interval training. Meckling (a): control diet + exercise versus control diet; Meckling (b): high protein diet + exercise versus high protein diet. Mohr 2014 (a): moderate intensity continuous training versus control; Mohr 2014 (b): high intensity interval training versus control. Schroeder 2018 (a): aerobic exercise; Schroeder 2018 (b): resistance exercise; Schroeder 2018 (c): combined exercise. Swift 2012 (a): higher energy expenditure (12 kcal/kg/week); Swift 2012 (b): lower energy expenditure (8 kcal/kg/week)
