
Figure 1.
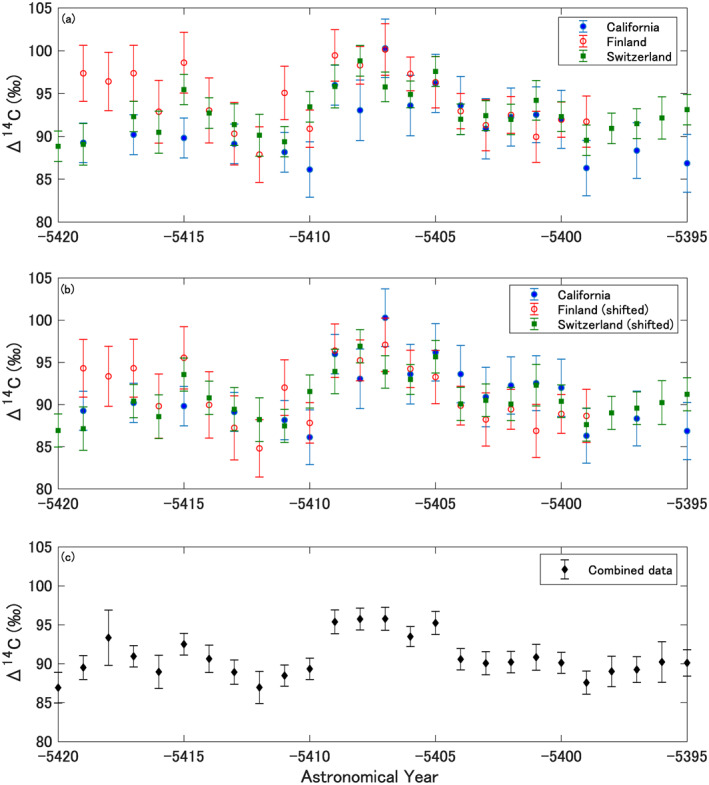
(a) Comparison of Δ14C values between the California bristlecone pine, Switzerland larch, and Finland Scots pine series. (b) The same as Figure 1a, but the Switzerland and Finnish series are shifted as minus 1.9‰ and 3.1‰ in the vertical axis direction. (c) Combined Δ14C values (weighted averages) of the three series in Figure 1b.