
Figure 2.
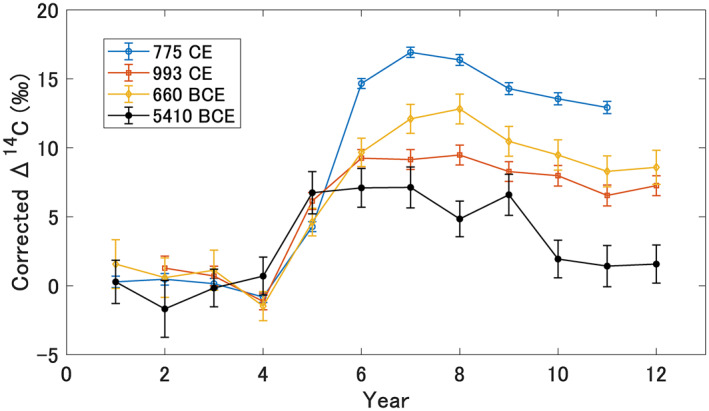
Comparison of the known annual cosmic ray events. The 774/775 CE event: open circles (Büntgen et al., 2018: mean of 26 sites from northern hemisphere), the 992/993 CE event: open squares (Büntgen et al., 2018: mean of seven sites from northern hemisphere), the ∼660 BCE event: open diamonds (Sakurai et al., 2020), and the 5410 BCE event: solid circles (this study). The horizontal line represents time in the unit of year, and the significant increases occur in year no.5. The vertical lines are shifted so that each baseline has an average of zero. The baselines are defined as the weighted average of the data before the significant increases (data of no. 1–4 or no. 2–4).