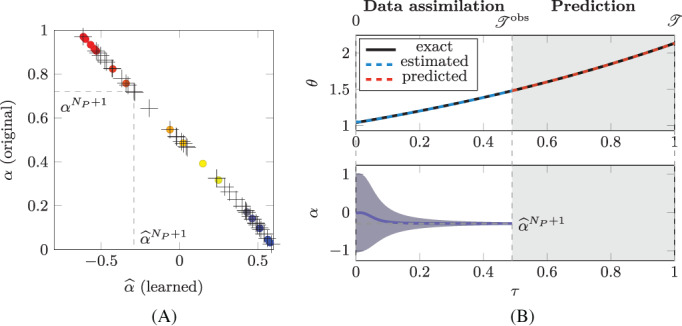
FIGURE 5.

Test Case 1. In (A), the colored circles represent the original parameters α i plotted against the corresponding learned parameters for the training individuals (i = 1, …, N P). Conversely, the black crosses represent the original parameters plotted against the corresponding estimated parameters for the testing individuals. In the first row of (B) we show the evolution of (blue solid line), while the black dashed line represent the value of estimated by means of the EKF algorithm (for ) and its predicted value (for ). In the second row of (B), we show the evolution of the estimation of the value of , with the ±3σ bands, where σ denotes the standard deviation of the estimate
