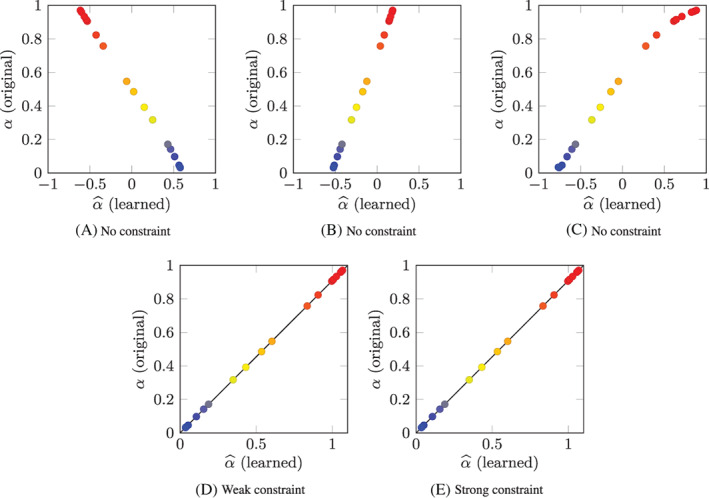
FIGURE 7.

Test Case 1: original parameters α i plotted against the corresponding learned parameters for the training individuals (i = 1, …, N P). The models considered in (A), (B) and (C) are obtained with the non‐constrained strategy, the model of (D) and (E) are obtained with the weak and the strong strategies, respectively. In (D) and (E), the black line represents the analytical solution
