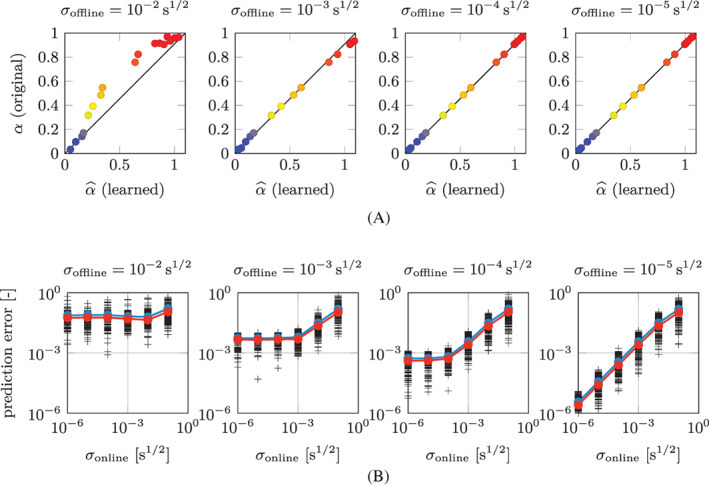
FIGURE 9.

Test Case 1: (A) original parameters α i plotted against the corresponding learned parameters for the training individuals (i = 1, …, N P), for different noise magnitudes σ offline and (B) overall L 2 relative prediction errors obtained for different values of σ offline and σ online. In (B), each black cross represent a testing individual, the blue curve represent the arithmetic mean, the red curve the geometric mean
