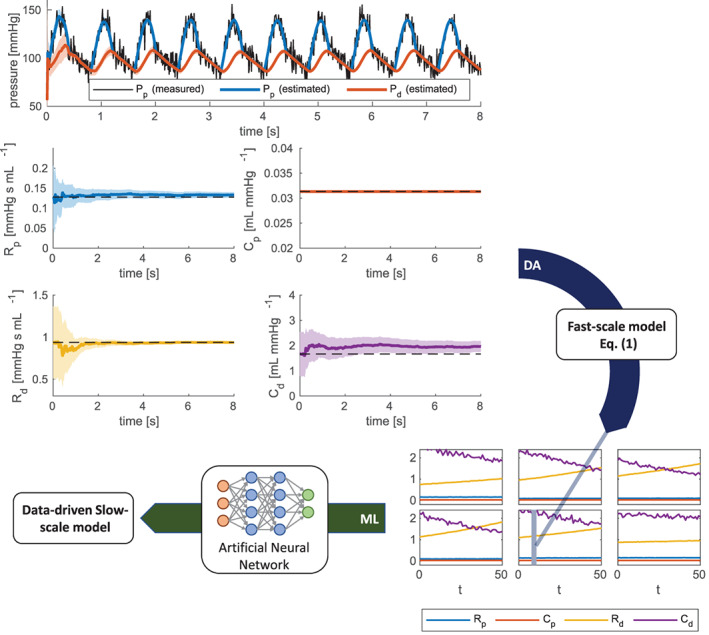
FIGURE 14.

Test Case 4: visual representation of the procedure followed to generate a data‐driven model for hypertension development (see Section 3.4.2). In the top part of the figure we represent in black the noisy measurement of P p associated with a given patient i and a to given slow‐time instant τ j. The colored line represent the time evolution of estimated values of the system state (P p and P d) and of the four parameters (R p, C p, R d and C d). The shadowed areas represent the ±3σ bands, where σ denotes the standard deviation of the estimate. By combining the estimated values of the parameters obtained for all patients and for all the slow‐time instants, we obtain an estimate of their slow‐scale evolution, represented in the bottom‐right part of the figure
