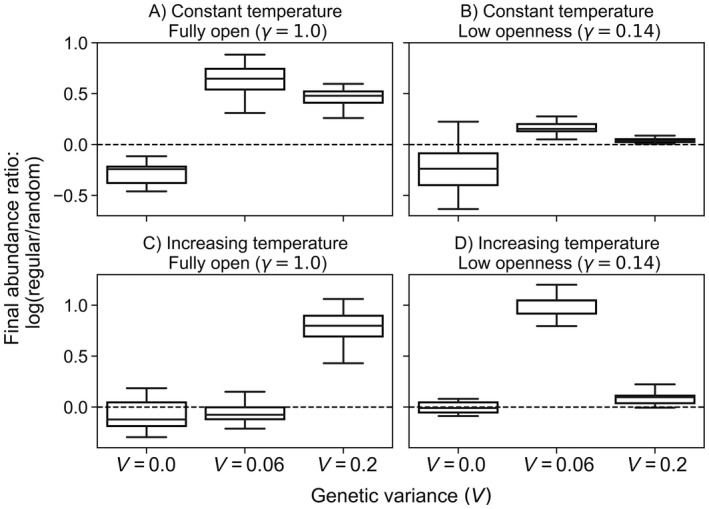
Fig. 2.

Influence of genetic variance on network‐wide mean abundance at different levels of system openness. Results above the dashed horizontal line indicate that final abundance is higher in regular than random networks while results below the line indicate the opposite. Note the change in scale between top and bottom rows.
