
Fig. 4.
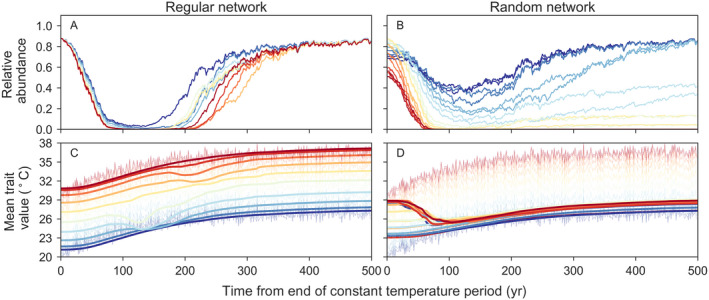
Illustrative trajectories of (A, B) relative abundance and (C, D) mean trait value (optimum growth temperature) by patch for regular and random networks. Simulations during the temperature increase period are for a system with low openness (γ = 0.14) and low additive genetic variance (V = 0.06). Trajectories are colored by relative patch temperature, where warmer and cooler colors represent higher and lower temperatures, respectively. Lines are mean trajectories averaged across 20 runs. Translucent lines in the bottom row are the temperature time series.