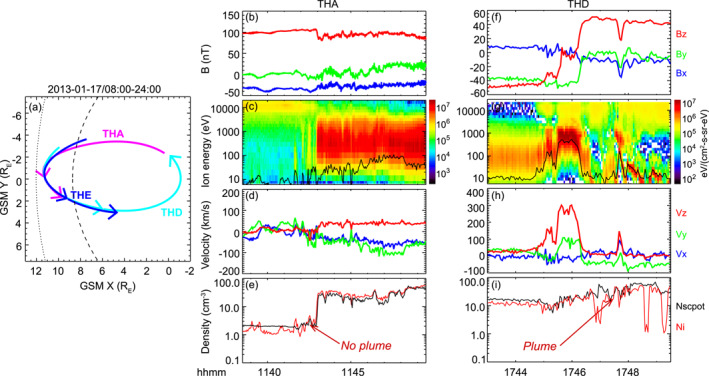
Figure 2.

(a) THA, THD, and THE locations during 08–24 UT on January 17, 2013 projected to the GSM X‐Y plane. The inner curve marks the magnetopause and the outer curve marks the bow shock. (b–e) THA measured magnetic field, ion energy spectrum, ion velocity, and ion density. The ion measurements were taken from ground Electrostatic Analyzer (ESA) moments. In addition to the ion density (red curve in Figure 2e), also shown is the plasma density inferred from spacecraft potential (black curve). Proton kinetic energy corresponding to the measured bulk flow velocity is indicated as black line in Panel (c). (f–i) Similar to Figures 2b–2e but showing measurements made by THD.
