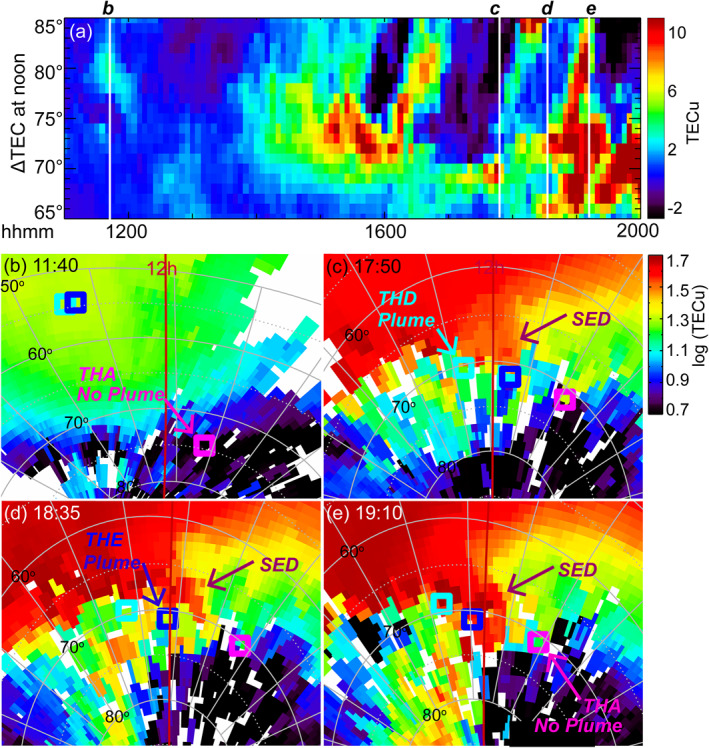
Figure 3.

(a) Time series plot of background‐subtracted TEC at 10–14 h MLT. The white lines overlain mark time instances when THEMIS spacecraft crossed the magnetopause. (b)–(e) Polar plots of TEC measurements with magnetic noon to the top. The gray contours mark latitudes and longitudes in geomagnetic coordinates. Footprints of THEMIS spacecraft based on T01 model are shown as open squares, which are colored coded in the same manner as Figure 2a. Spacecraft that detected plumes are labeled as “plume,” otherwise labeled as “no plume.”.
