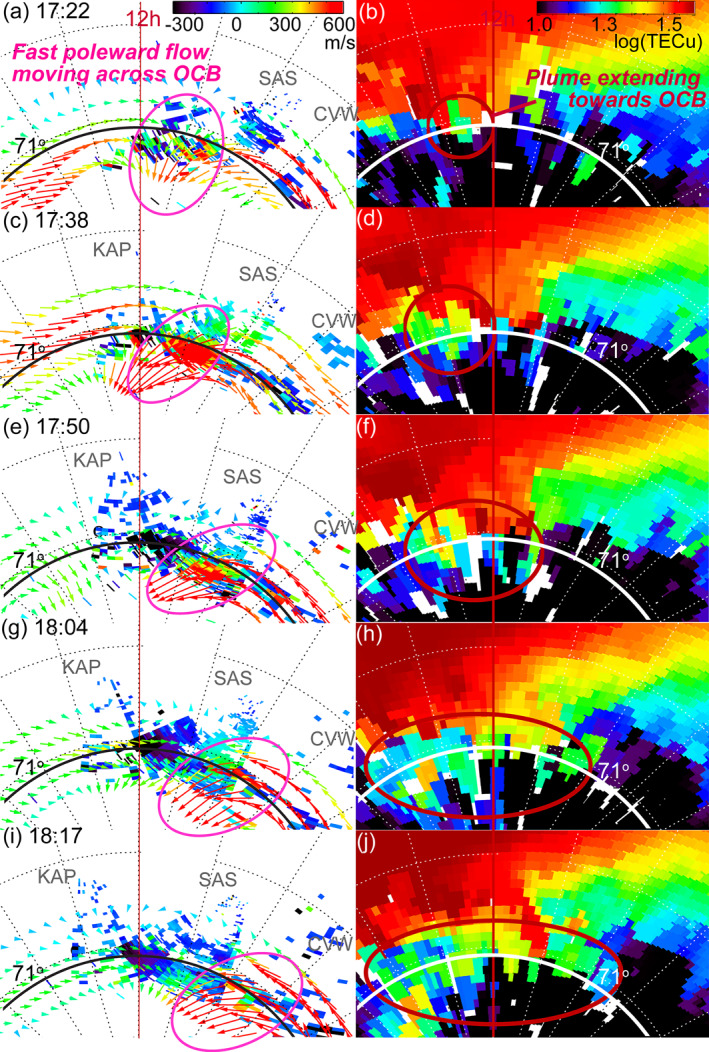
Figure 5.

(Left column) Maps of plasma convection plotted in geomagnetic latitude‐MLT coordinates with magnetic noon at the top. The color tiles represent line‐of‐sight velocity measurements and the corresponding radar are labeled in gray. Positive values represent plasma moving away from the radar. The color arrows represent the spherical harmonic fitted velocity vectors. To reduce the clutter, the velocity vectors (color arrows) are plotted with a spatial resolution of 2° in latitude and longitude, and only those around the open‐closed field line boundary (OCB) latitude are shown. The OCB latitude is indicated. Regions of fast poleward flows moving across the OCB are highlighted with magenta circles. (Right column) Maps of TEC plotted in geomagnetic latitude‐MLT coordinates with magnetic noon at the top. The OCB latitude is indicated. Portions of storm enhanced density extends to the OCB are highlighted with red circles. The red vertical line on the TEC maps on the right represents local noon.
