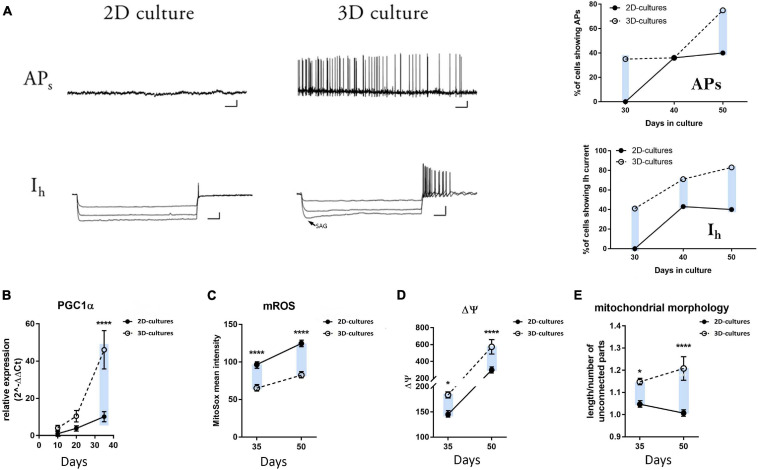
FIGURE 4.
Electrophysiological and metabolic analyses of mDA neuron maturation in the 2D and 3D cultures. (A) Representative traces of whole-cell patch clamp recordings of hiPSC-derived neurons in 2D and 3D cultures at day 30. The arrow for the hyperpolarization-activated cation current (Ih) in the 3D cultures indicates the voltage-sag response upon hyperpolarizing current injections characteristic of the HCN channel activation. Scale bars APs: 10 mV/4 sec; Ih: 20 mV/200 ms. No spontaneous or evoked APs and no Ih could be recorded for the neurons cultured in 2D (n = 0/14 neurons). Plots on the right display the percentage of cells showing spontaneous APs and the presence of Ih at days 30, 40, and 50 during neuronal differentiation. (B) qRT-PCR analysis of PGC1-α at days 10, 20, and 35 of differentiation. (C) mROS production, (D) mitochondrial membrane potential, and (E) mitochondrial morphology in the differentiating neurons at days 35 and 50. The blue bars are illustrating an ameliorated phenotype of 3D cultures compared to the 2D counterpart.

