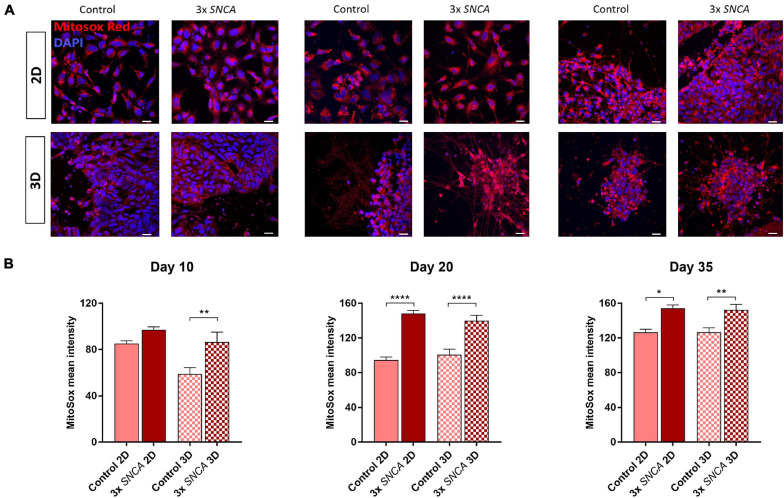
FIGURE 5.
Mitochondrial superoxide levels (mROS) quantified with the fluorogenic dye MitoSox Red in 2D and 3D cultures. (A) Representative fluorescence images at different time points. (B) Quantification of MitoSox intensity (mean ± SEM) in DA neurons differentiated from a control and a PD patient (3x SNCA mutant) hiPSC line at days 10, 20, and 35 during neuronal differentiation. Data are derived from two independent experiments. Scale bars represent 50 μm. Statistical differences were calculated by one-way ANOVA followed by Tukey’s post hoc test to correct for multiple comparisons *p ≤ 0.05, **p ≤ 0.01, ****p ≤ 0.0001.

