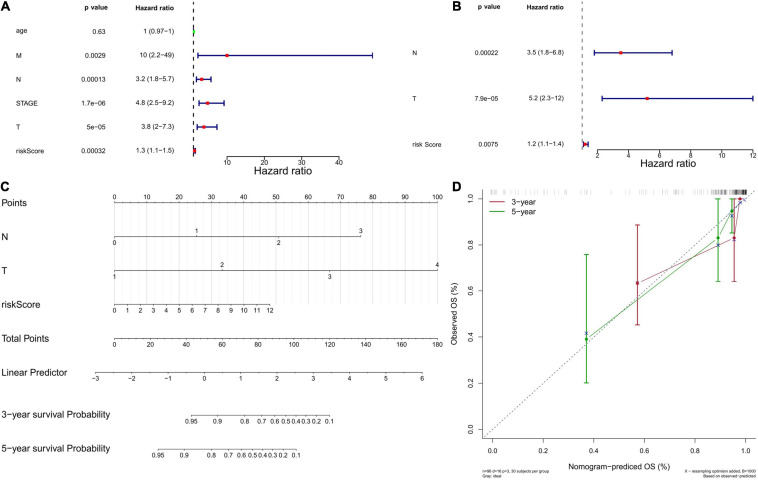
FIGURE 5.
Independent prognostic value of the six-gene prognostic model. (A) Independent prognostic factors as determined by the Univariate Cox regression analysis. The left side represents the gene, corresponding P value, and HR value. The red square on the right indicates that the HR value is greater than 1, the green square indicates that the HR value is less than 1, and the line segments on both sides of the square are 95% confidence intervals of the HR value. (B) Independent prognostic factors as determined by the Multiple Cox regression analysis. (C) The nomogram to predict overall survival was created based on three independent prognostic factors. Each factor corresponds to a score, and the sum of the total scores of each factor corresponds to the total score. The 1-year, 3-year, and 5-year survival rate is predicted according to the total score. (D) The correction curve based on the above prediction model. The c-index of the model is 0.902371, and the corrected c-index is 0.887527.

