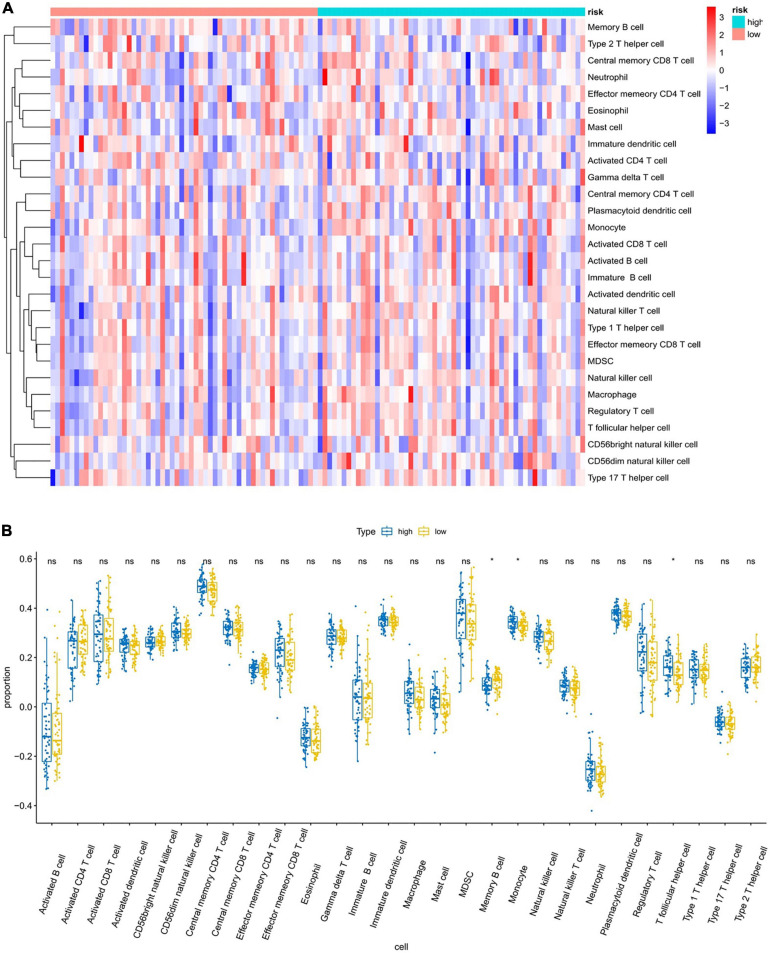
FIGURE 9.
Analysis of immune infiltration patterns in breast cancer samples from TCGA dataset via an ssGSEA score-based method. “ns” represents that there is no significant difference in the infiltration of immune cells between the two samples; “*” represents P < 0.05. (A) Heatmap of ssGSEA scores (red = positive, blue = negative). (B) Boxplot of ssGSEA scores of the 28 representative gene sets.

