Figure 2.

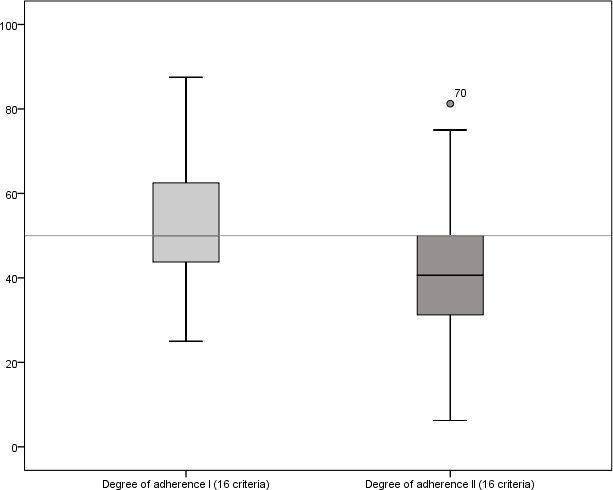
Illustration of the degree of adherence per study (%) in a box plot (n=212). Degree of adherence I (quantitative implementation), degree of adherence II (qualitative implementation).

Illustration of the degree of adherence per study (%) in a box plot (n=212). Degree of adherence I (quantitative implementation), degree of adherence II (qualitative implementation).