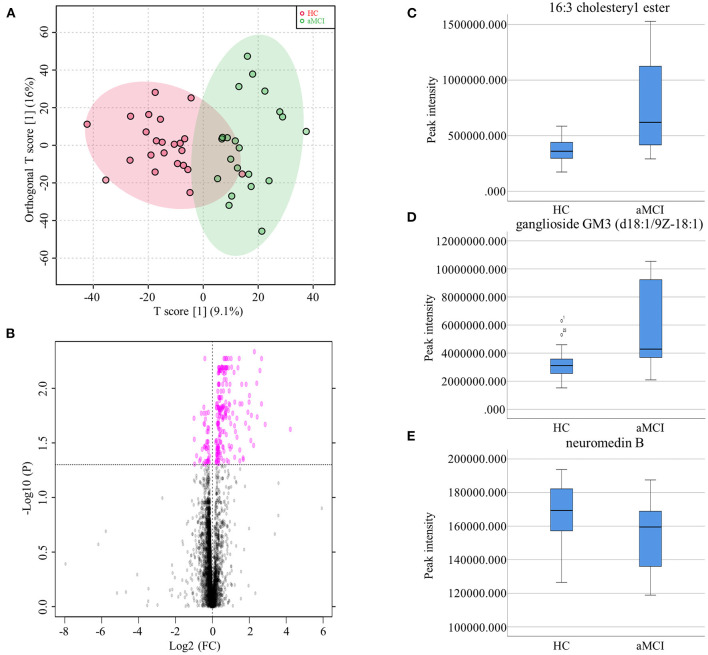
Figure 3.
(A) Orthogonal partial least squares discriminant analysis diagram of HC and aMCI comparison. (B) Volcano Plots of HC and aMCI comparison. (C) Box plots showed the different peak intensity of 16:3 cholesteryl ester between HC and aMCI groups. (D) Box plots showed the different peak intensity of ganglioside GM3 (d18:1/9Z-18:1) between HC and aMCI groups. (E) Box plots showed the different peak intensity of neuromedin B between HC and aMCI groups.

