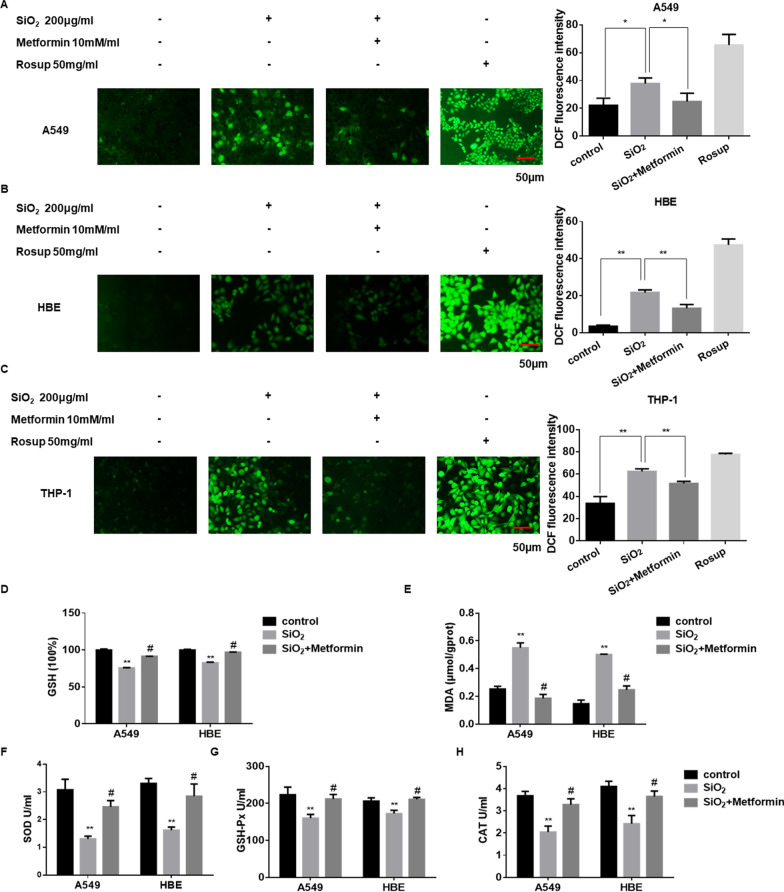
Fig. 4.
Metformin inhibits SiO2-induced oxidative stress. A–C The intracellular ROS generation of A549 (A), HBE (B), and THP-1 (C) cells were determined by the DCFH-DA probe, respectively. With *p < 0.05 and **p < 0.01 vs. control or silica group. D, E A549 and HBE cells were treated with silica and metformin for 24 h. The levels of GSH (D) and MDA (E) were determined by commercial kits. With **p < 0.01 vs. control and #p < 0.05 vs. the silica group. The levels of SOD (F), GSH-Px (G) and CAT (H) in cell supernatant. With **p < 0.01 vs. control and #p < 0.05 vs. the silica group

