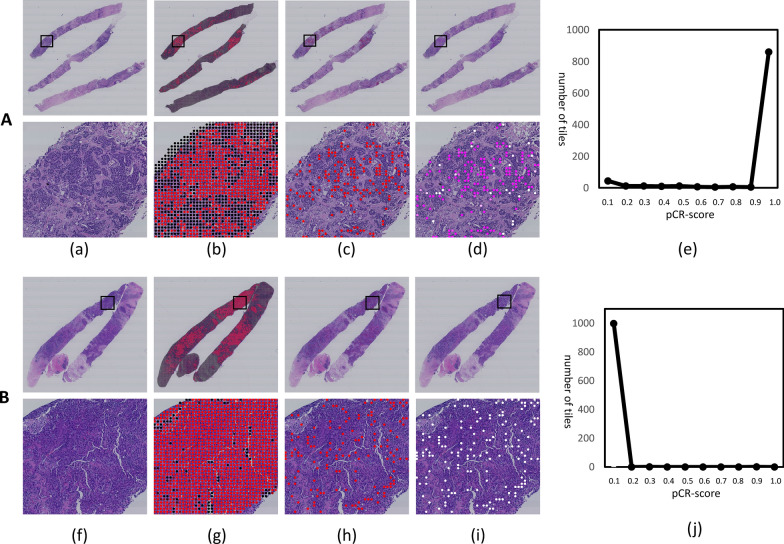
Fig. 2.
Examples for the pCR prediction of based on CNNs. A An example of pCR: a shows a represnetative WSI from a patient who achieved the pCR. bThe probability map of TE produced by the CNN I. c The selection of tiles with a high probability of TE. d The map produced by CNN II showing the pCR probability for image a, where pink and white separately represent high and low probabilities of pCR. e The distributions of tile-level pCR scores of the image a. B An example of non-pCR: f shows a representative WSI from a patient who did not achieve the pCR. g, h, and i for image f are corresponding to the steps of b, c, and d for image a. j A predominant distribution of low pCR scores for image f

