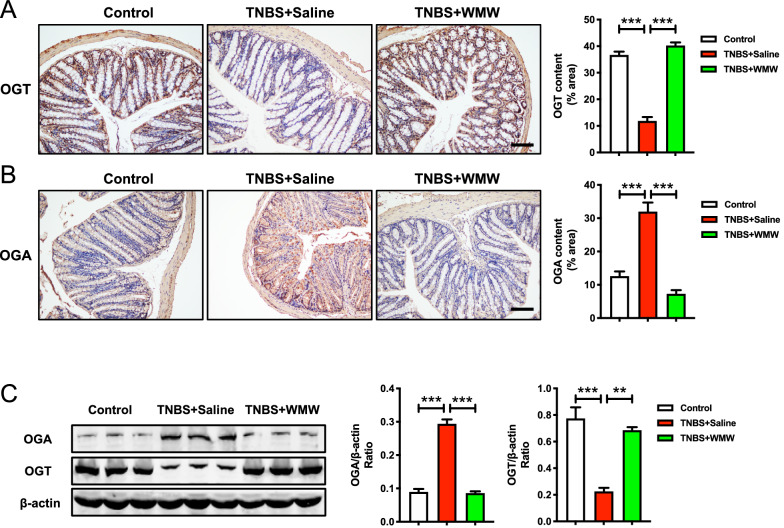
Fig. 7.
WMW regulates OGT and OGA activities in TNBS-induced colitis. A Representative immunohistochemistry staining for OGT of different groups, and the quantification of OGT immunohistochemistry staining. Scale bar, 100 μm. (n = 4–6). B Representative Immunohistochemistry staining for OGA of different groups, and the quantification of OGA immunohistochemistry staining. Scale bar, 100 μm. (n = 4–6). C Representative western blots for OGT and OGA protein expressions in colon, and the quantification of OGT and OGA western blots. (n = 6). All data are presented as means ± SEM. *p < 0.05, ** p < 0.01, ***p < 0.001

