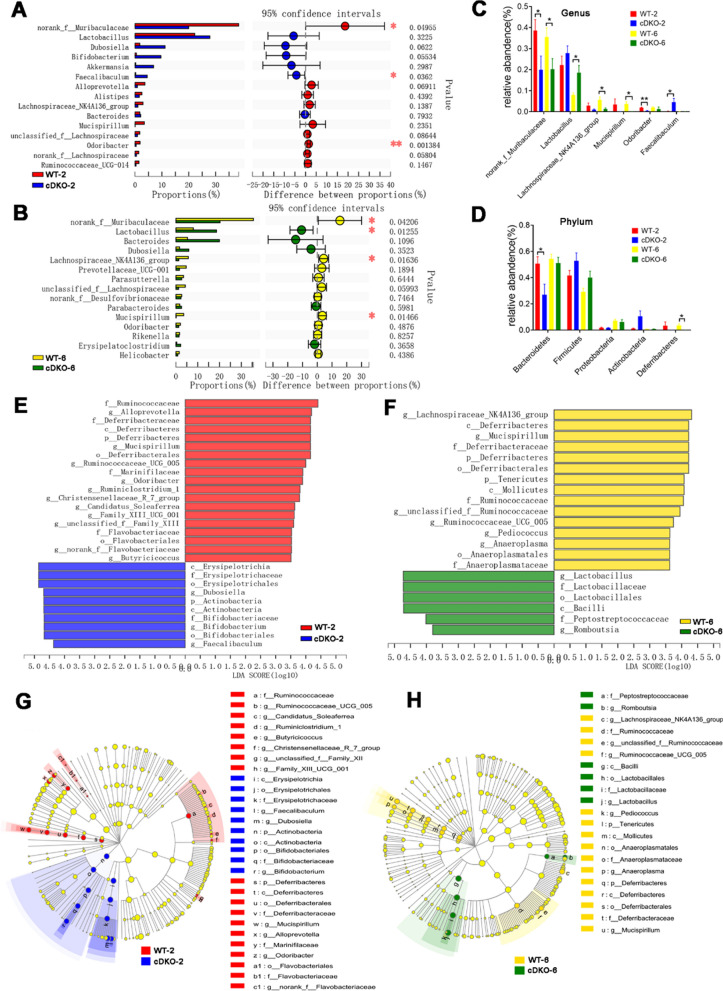
Fig. 6.
The differentially taxa of gut microbiota in PS cDKO mice versus WT mice. Differential abundance analysis of taxa on the genus level (top 15) between WT and PS cDKO mice at age of 2 months (A) and 6 months (B). Student’s t-test, ∗ P < 0.05, ∗ ∗ P < 0.01. C: Comparison of relative abundance of significantly altered bacterial taxa on genus level between WT and PS cDKO mice. ∗ P < 0.05, ∗ ∗ P < 0.01. D: Comparison of relative abundance of gut microbiota on the genus level (top 5) between WT and PS cDKO mice. ∗ P < 0.05. LEfSe analysis from the phylum to genus level at age of 2 months (E) and 6 months (F). Taxa enriched in PS cDKO mice are indicated by a negative LDA score (blue for cDKO-2 group; green for cDKO-6 group), and taxa enriched in WT groups have a positive LDA score (red for WT-2 group; yellow for WT-6 group). The LDA score threshold is ≥ 3.5. G and H: The cladogram of enriched taxa from the phylum to genus level, N = 6

