
FIGURE 3.
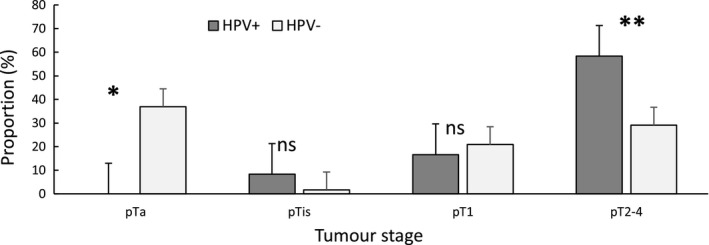
Percent distribution of tumor stages among human papillomavirus (HPV)‐negative (N=216) and HPV‐positive groups (N=12). Error bars represent the standard error. ns: non‐significant, * p = 0.004, ** p = 0.03
Official websites use .gov
A
.gov website belongs to an official
government organization in the United States.
Secure .gov websites use HTTPS
A lock (
) or https:// means you've safely
connected to the .gov website. Share sensitive
information only on official, secure websites.
Percent distribution of tumor stages among human papillomavirus (HPV)‐negative (N=216) and HPV‐positive groups (N=12). Error bars represent the standard error. ns: non‐significant, * p = 0.004, ** p = 0.03