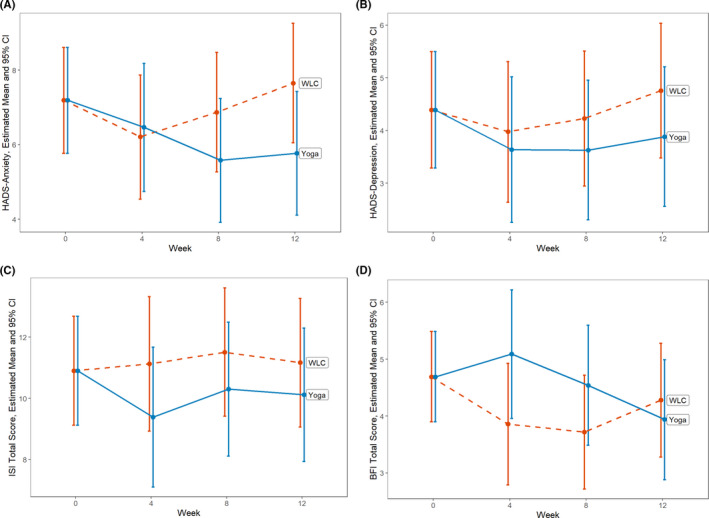
FIGURE 1.

Health‐related quality of life outcome changes by week and treatment arm. Data points represent the model‐estimated means and 95% confidence intervals (indicated by the I bars) from a constrained linear mixed model (cLMM) with baseline means constrained to be equal across study arms, reflecting the pre‐randomization nature of the baseline assessment. See Methods section for model details. A, HADS Anxiety subscale ranges from 0 to 21, with higher scores indicating higher anxiety symptoms. B, HADS Depression subscale ranges from 0 to 21, with higher scores indicating higher depressive symptoms. C, ISI Total score ranges from 0 to 28, with higher scoring indicating higher insomnia symptoms. D, BFI Total score ranges from 0 to 10, with higher scores indicating higher fatigue. Abbreviations: BFI, Brief Fatigue Inventory; CI, confidence interval; HADS, Hospital Anxiety and Depression Scale; ISI, Insomnia Severity Index; WLC, wait‐list control
