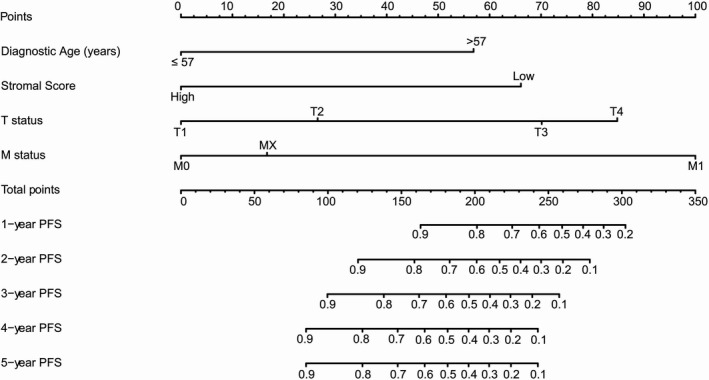
FIGURE 4.

A prognostic nomogram predicting 1‐, 2‐, 3‐, 4‐, and 5‐year progression‐free survival (PFS) of papillary thyroid carcinoma. For using the nomogram, values of each variable from an individual patient are located on each variable axis, and a line is drawn upward to determine the points obtained for each variable on the point axis. The sum of these numbers is located on the total points axis, and a line is drawn downward to the survival axis to determine the likelihood of 1‐, 2‐, 3‐, 4‐, and 5‐year PFS. T, Tumor; M, Metastasis; MX, Metastasis cannot be measured
