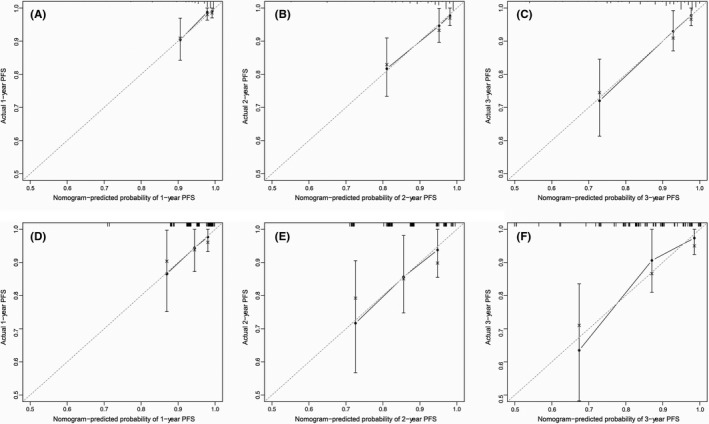
FIGURE 5.

Calibration plots of progression‐free survival (PFS) associated nomogram in both training and validation cohorts. (A, B, C) Calibration plots of 1‐, 2‐, and 3‐year PFS in the training cohort. (D, E, F) Calibration plots of 1‐, 2‐, and 3‐year PFS in the validation cohort
