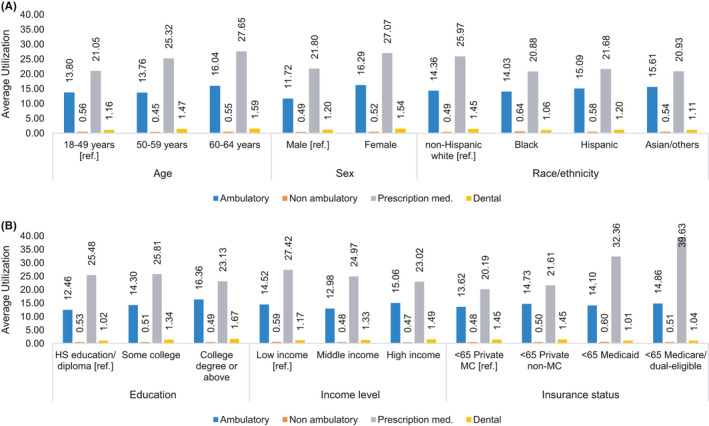
FIGURE 1.

Average services utilization per person per year by (A) demographic characteristics, (B) socioeconomic characteristics, among insured non‐elderly cancer survivors, 2011–2015. Estimates represent average adjusted prediction (AAP) from negative binomial model for each service type. Estimation models were adjusted for age, sex, race/ethnicity, marital status, income level, education, census region, insurance status, number of Medical Expenditure Panel Survey (MEPS) priority conditions, and self‐reported health status. Low income represents family income (FI) <200% of federal poverty level (FPL), middle income represents FI 200% to <400% of FPL, and high income represents FI ≥400% of FPL
