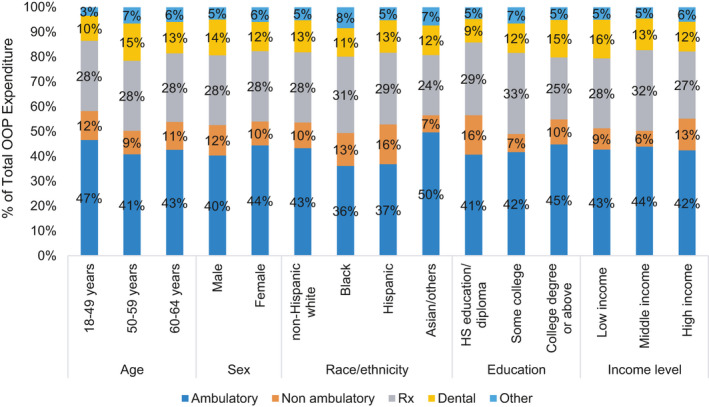
FIGURE 2.

Percent contribution of service‐specific out‐of‐pocket (OOP) expenditure to total OOP expenditure by sociodemographic characteristics, non‐elderly cancer survivors, 2011–2015. Low income represents family income (FI) <200% of federal poverty level (FPL), middle income represents FI 200% to <400% of FPL, and high income represents FI ≥400% of FPL
