
FIGURE 4.
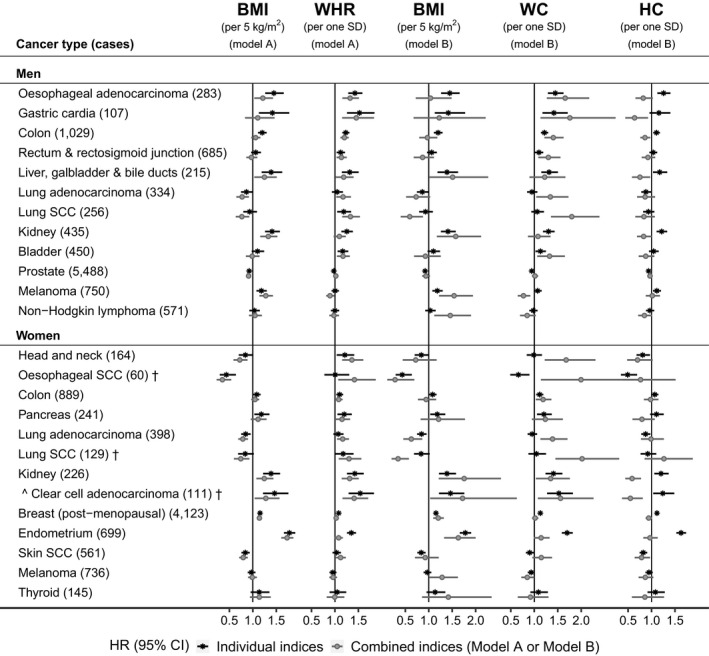
Traditional body shape indices in relation to cancer risk by sex. †—cancers with less than 20 cases in women pre‐menopausal at baseline, for which models were not adjusted for menopausal status; BMI, body mass index; CI, confidence interval; HC, hip circumference; HR, hazard ratio; SCC, squamous cell carcinoma; SD, standard deviation; WC, waist circumference; WHR, waist‐to‐hip ratio. HRs (95% CI) were obtained from delayed entry Cox proportional hazards models stratified by age at baseline and region of the assessment center. Individual indices—models included individually each of BMI, WHR, WC or HC with adjustment variables; Combined indices—models included combinations of obesity indices with adjustment variables; Model A—included BMI and WHR with adjustment variables. Model B—included BMI, WC, and HC with adjustment variables; Men—models were adjusted for height, weight change during the year preceding baseline, Townsend deprivation index, smoking status, alcohol consumption, physical activity, consumption of fresh fruit and vegetables, processed meat and red meat, family history of cancer and, for skin SCC and melanoma, sun‐exposure‐related factors. Women—models included adjustment variables as for men, with the addition of menopausal status (except for cancers marked with †), use of hormone replacement therapy, ever use of oral contraceptives, and age at last live birth (with “no live births” as one of the categories). Cancer types and subtypes are defined in Supplementary Methods according to the 10th edition of the International Statistical Classification of Diseases (ICD10). This figure includes individual cancers showing statistically significant associations with BMI or with allometric body shape indices used as continuous variables. For esophageal SCC in women, the upper limit of the 95% CI for WC in the models with combined indices was 3.49 and the lower limit for HC was 0.39. Numerical values for HR (95% CI) estimates are shown in Table S4