FIGURE 3.

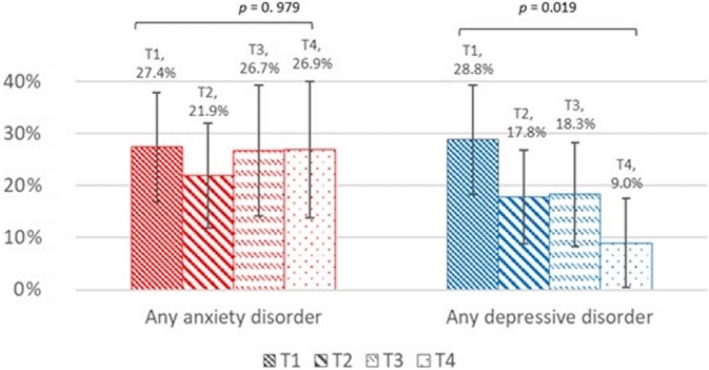
Change in rates of any anxiety and depressive disorders along time. Error bars represent 95% confidence interval. P‐values are derived from Friedman's χ 2 test

Change in rates of any anxiety and depressive disorders along time. Error bars represent 95% confidence interval. P‐values are derived from Friedman's χ 2 test