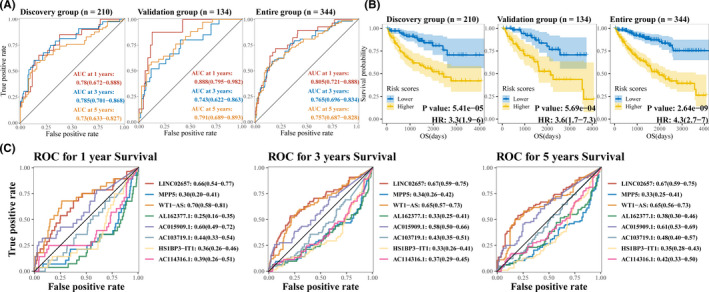
FIGURE 7.

Estimation and validation of gene signature. (A)Time‐dependent ROC curve for predicting 1‐, 3‐, and 5‐year survival with gene signature in discovery group, validation group and entire group. AUC along with 95% CI was displayed. (B) Kaplan–Meier survival curves showing overall survival outcomes for the high‐ and low‐risk patients in discovery group, validation group and entire group, the risk group of high risk and low risk was based on median risk scores based on gene signature. (C) Time‐dependent ROC curve for predicting 1‐, 3‐, and 5‐year survival with genes in the gene signature was explored in the entire group
