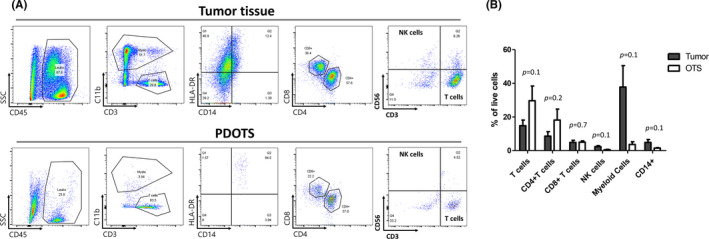
FIGURE 5.

Immune cell profiling of PDOTS. (A) Representative dot plot images of immune cell analysis. Singlets, live cells, and whole immune cells (leukocytes) were sequentially gated. Leukocytes were divided to myeloid cells and T‐cell population. Myeloid cells were further analyzed using CD14 and HLA‐DR. T cells were further analyzed to CD4+ T cells and CD8+ T cells. NK cells were analyzed using CD56. (B) Flow cytometry analysis of immune cell population in tumor and OTS. Mean and SEM were plotted
