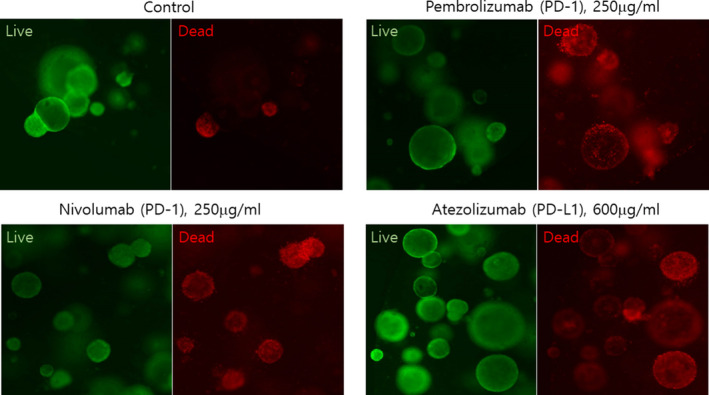
FIGURE 6.

The response of PDOTSs to immune checkpoint blockades. Live/dead analysis of PDOTS performed on day 5 following treatment with PD‐1 (pembrolizumab, 250 μg/ml and Nivolumab, 250 μg/ml) or PD‐L1 (atezolizumab, 600 μg/ml, n = 3, biological replicates; representative images shown). Scale bar, 200 μm
