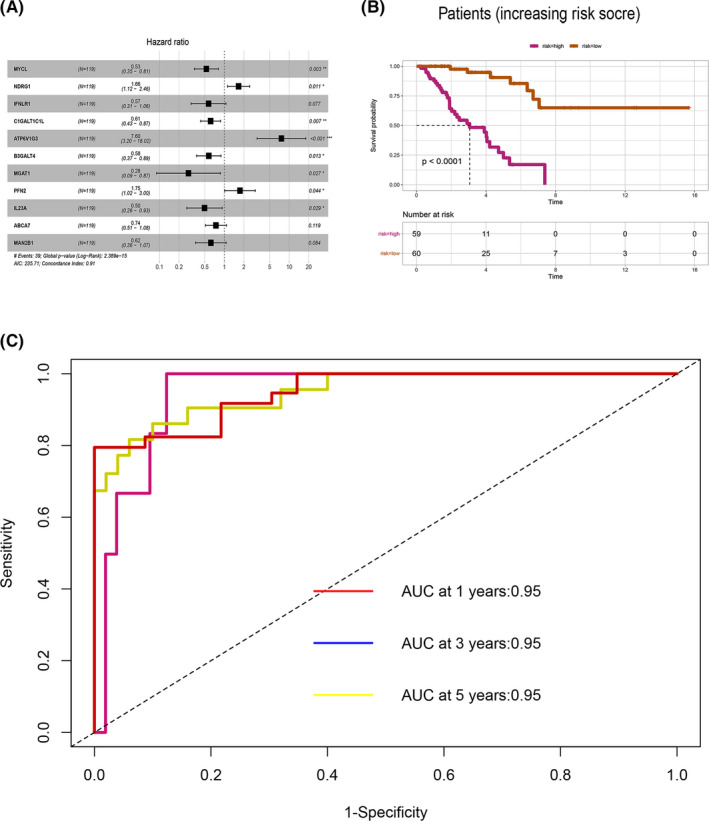
FIGURE 9.

Hub genes for the osteosarcoma prognostic model. (A) Multivariate cox regression analysis of hub genes. (B) Kaplan–Meier curves showing the OS of patients with high and low prognostic scores. (C) The time‐dependent ROC curves displaying the prognostic prediction of the hub genes model
