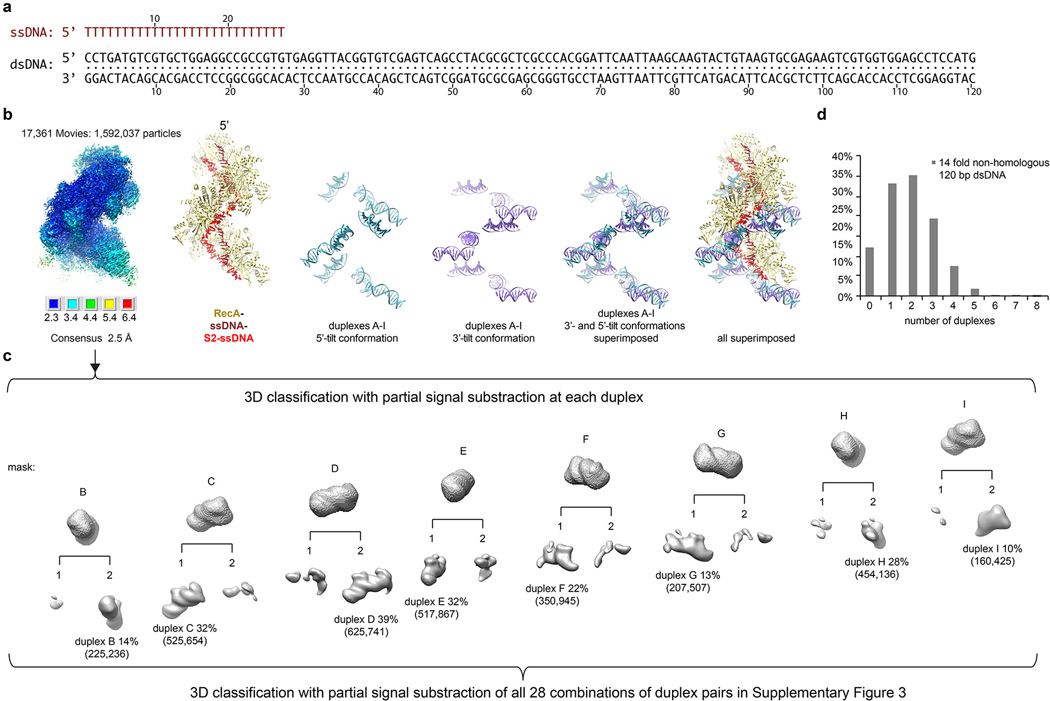
Extended Data Figure 5 |. Cryo-EM analysis of the strand exchange reaction with non-homologous 120 bp dsDNA.
a, Sequences of the 27 nt ssDNA (top, brown) and the 120 bp non-homologous dsDNA (bottom, black) used for this data set.
b, Starting from the left, consensus reconstruction map of this dataset colored by local resolution estimated with the RELION3 post-processing program. The resolution range is mapped to the colors in the inset below the map. Next, cartoon representation of the refined model of the consensus refinement. Primary ssDNA is colored in brown, S2 ssDNA red, and RecA is khaki. Cartoon representation of duplexes A to I in the 5’-tilted (cyan) and 3’-tilted conformations (purple), followed by the superposition of the two. Last, all cartoons superimposed highlighting the tilt difference, and the relative organization of the DNA elements on the filament.
c, Masks and maps of the 3D classification for individual duplexes as in Extended Data Fig 2e. The overall duplex occupancy of up to 39 % is higher, with 1.9 duplexes per particle on average, as expected from the presence of nearly twice the number of binding sites corresponding to a duplex compared to the 67-bp non-homologous dsDNA reaction. The mid-filament duplexF and duplexG were again outliers with low relative occupancy (22 % and 13 %, respectively), consistent with the crowded filament mid-portion having low accessibility for dsDNA. And, as before, duplexB and duplexI at the poorly-ordered filament termini resulted in apparently low occupancy (14 % and 10 %, respectively). Masks and maps of the 3D classification for all 28 combination of duplex pairs are shown in Supplementary Figure 3 and their details listed in Supplementary Spreadsheet 4. Paired-duplex 3D classification showed a distribution qualitatively very similar to that of the 67 bp dsDNA reaction, including the preference for 5’ tilts at the 3’ but not 5’ end of the filament.
d, Chart of the percentage of particles that have the indicated number of duplexes for this dataset. The data set was collected once. Also see Supplementary Spreadsheet 3 for more details.

