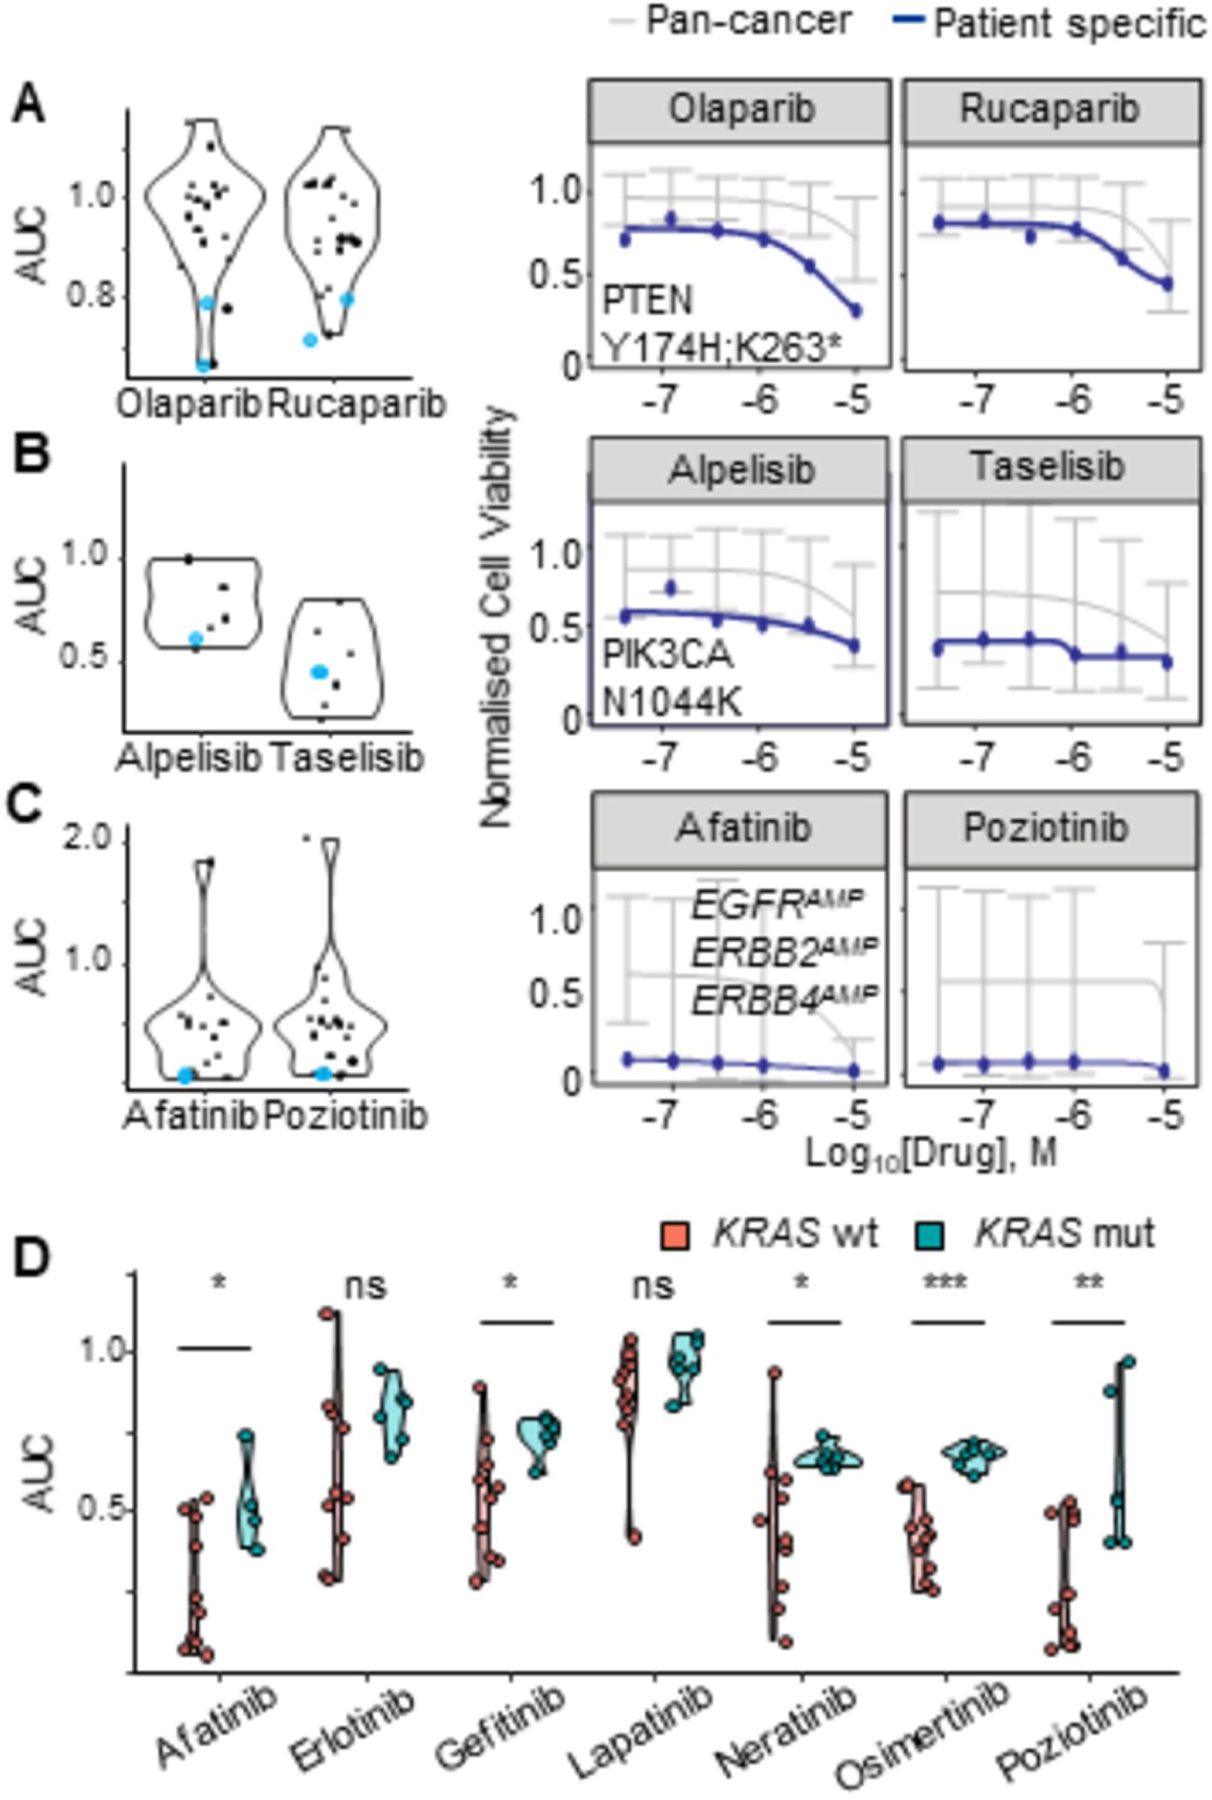
Figure 3. Concordant patient specific genomic alterations and peritonoid drug responses.

Peritonoid dose response AUC data displayed as a violin plot for inhibitors of: (A) PARP; (B) PI3K; (C-D) EGFR. (A-C) Blue data points indicate the peritonoid with dose response curves displayed on right: (A) Patient 5 PTEN Y174H,K263; (B) Patient 1 PIK3CA N1044K; (C) Patient 3 EGFRAMP, ERBB2AMP, ERBB4AMP. Blue line on dose response curves is patient specific response, grey line indicates average response for previously screened cancer organoid and cell lines. AUC, area under the curve, AMP, copy number gain.
