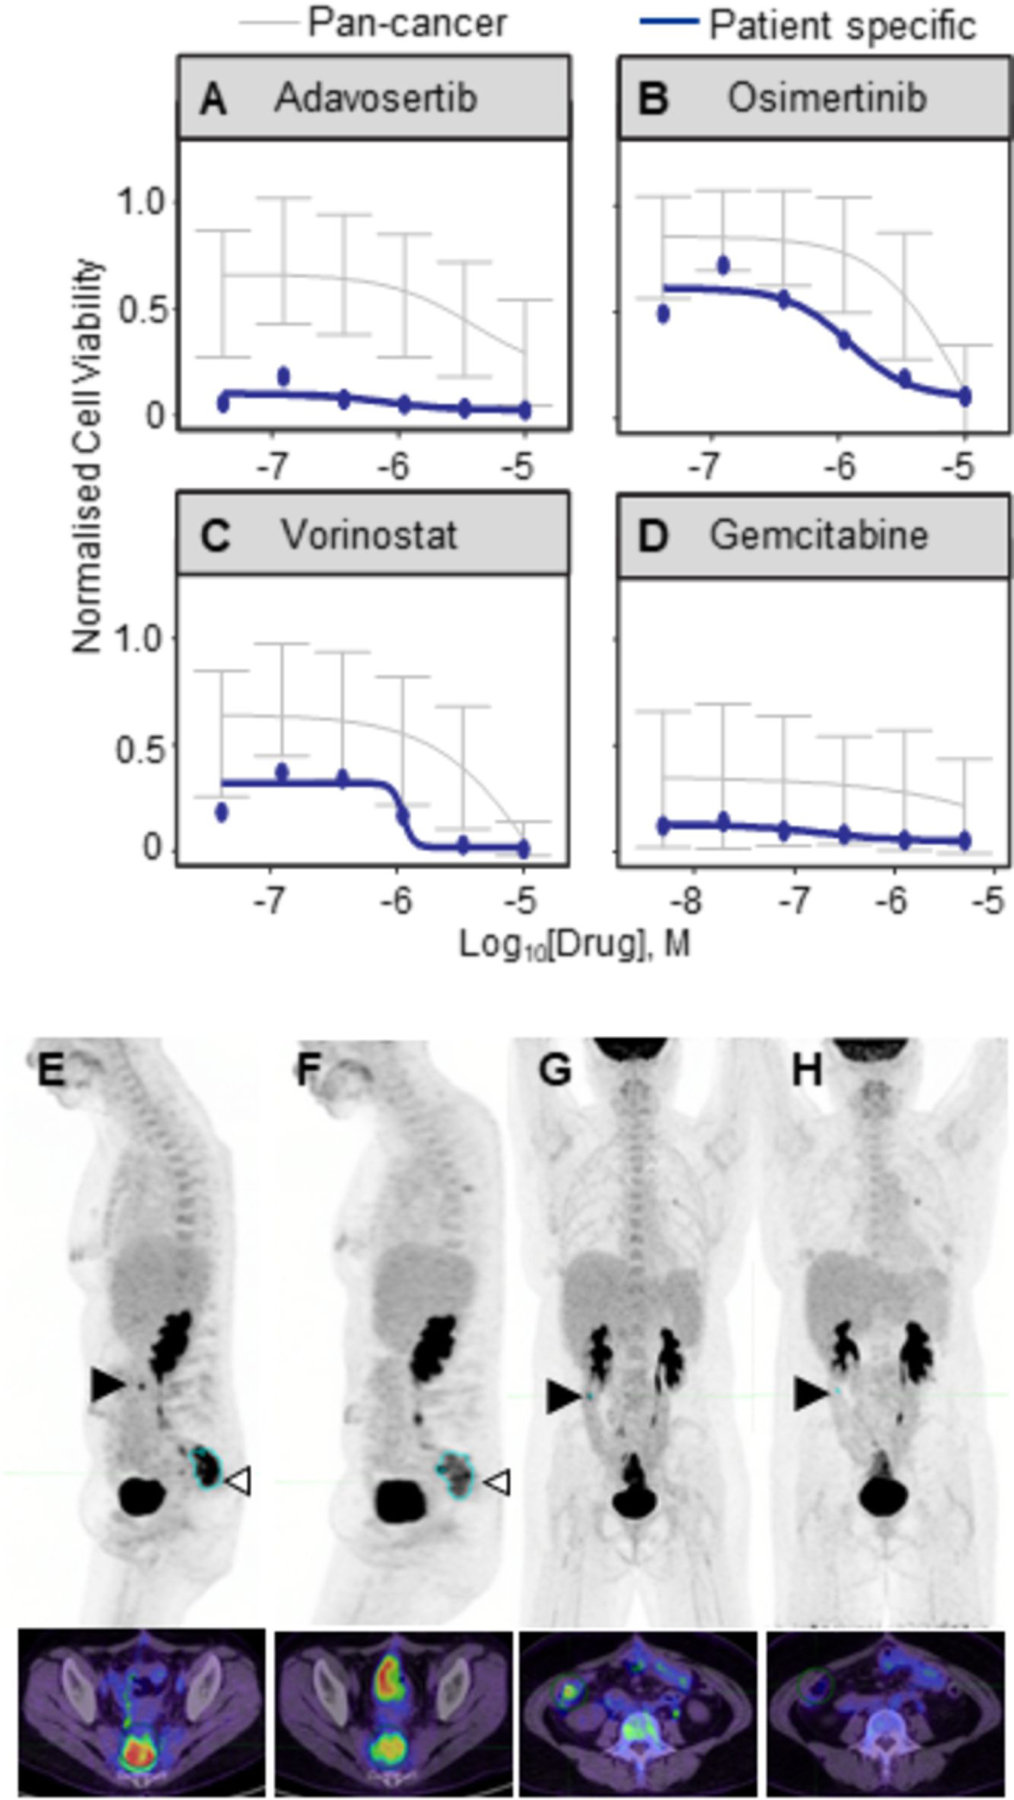
Figure 4. Peritonoid-guided drug choice for chemo-refractory disease.

Disease in 43 year old patient 2 worsened despite standard care surgery and 5 rounds of chemo(radio)therapy, including EGFRi treatment. The medical oncology team considered candidate alternate therapies based on peritonoid testing results. Peritonoid dose response curves (in blue) for (A) Wee1 inhibitor Adavosertib, (B) Osimertinib, (C) Vorinostat and (D) Gemcitabine. In grey is average cell viability from prior SEngine testing of cancer cell and organoid lines. Error bars denote st dev. FDG-PET-CT scan of patient immediately prior to treatment change (E, G) and 3 months after change to Gemcitabine (F, H). (E, F) Sagittal and (G, H) frontal images. Position of the transverse axial slice (bottom) is indicated by open arrowhead in top image. Pelvic hotspot marked in blue (E, F) has reduced from 15 to 9.7 and right abdomen lesion (closed arrow, serosal deposit on bowel) is no longer visible.
