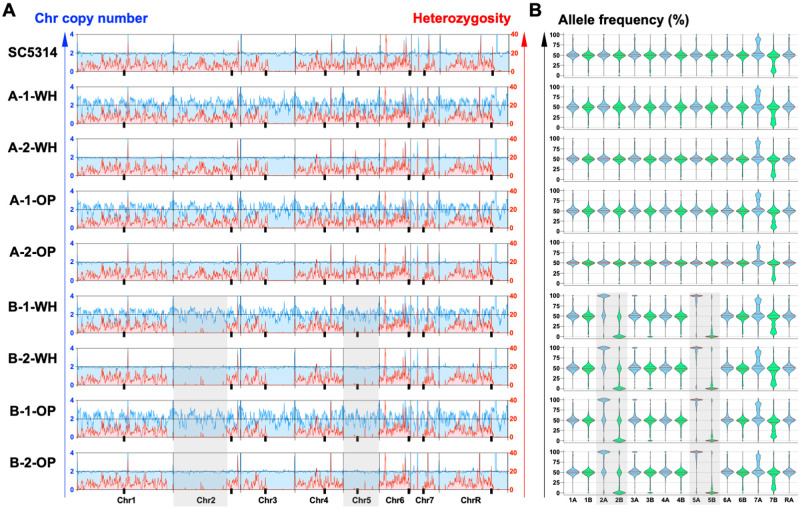
Figure 2.
Chromosome copy numbers and heterozygosity levels for white and opaque isolates. (A) Coverage was normalized to disomic levels and relative read depth was plotted across all eight Candida albicans chromosomes to determine their relative copy numbers, plotted in blue. The number of heterozygous positions was examined for each chromosome and average heterozygosity per 10 kbp window is plotted in red. Lines and tick marks denote chromosomes and centromere positions, respectively, on each chromosome. Shaded boxes indicate LOH regions unique to the B-1 and B-2 lineages. The parental strain SC5314 is included for reference. WH, white state; OP, opaque state. (B) Allele frequencies were determined for white/opaque cells and parental strain SC5314. Frequencies were compared across chromosomes as indicated for homolog A (blue) and homolog B (green) for each isolate. Note that allele frequencies have a median value of ∼50% for heterozygous disomic chromosomes, whereas median values are skewed toward 0% or 100% for chromosomes that are homozygous. Center lines represent median frequencies, upper and lower lines indicate 25th and 75th percentiles, shaded boxes indicate LOH regions unique to the B-1 and B-2 lineages.

