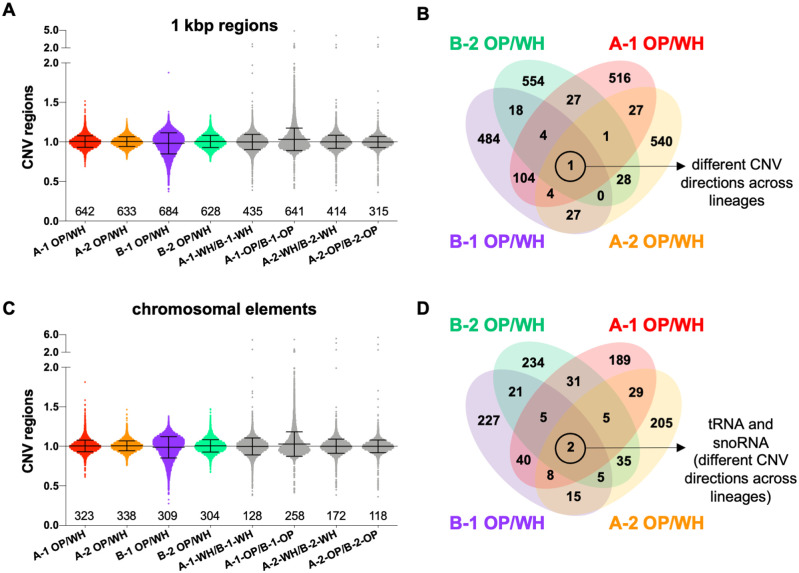
Figure 4.
Copy number variation (CNV) between white and opaque cells. CNVs were identified using read coverage depth across 1 kbp windows (A) and different chromosomal elements (C) for the four A and B lineages (using two standard deviations above or below coverage levels as cutoffs for CNV). Comparisons were made between white/opaque states within a lineage and between A and B lineages for cells of the same type within the same sequencing run. Numbers indicate the total number of CNV regions identified in each comparison (above or below two standard deviations), lines indicate means and standard deviations. OP, opaque; WH, white. Venn diagrams indicate the number of shared CNVs identified between cell states for 1 kbp windows (B) and for chromosomal elements (D). Control comparisons between lineages as well as a full list of the common regions along with corresponding Candida albicans genome annotations are included in Supplementary Table S1.

