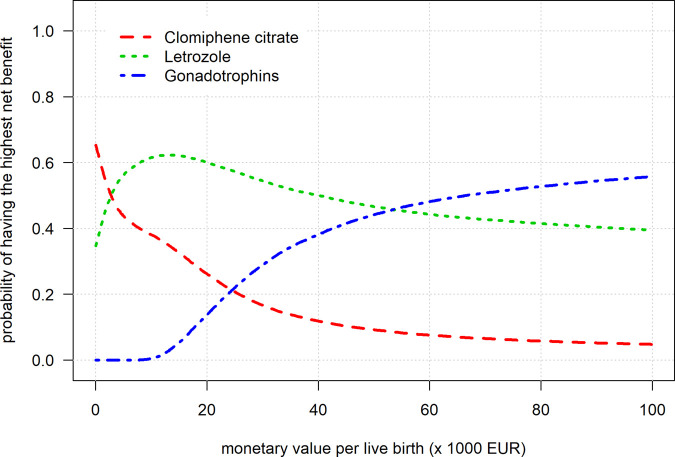
. 2021 Feb 22;36(5):1288–1295. doi: 10.1093/humrep/deab013
© The Author(s) 2021. Published by Oxford University
Press on behalf of European Society of Human Reproduction and
Embryology.
This is an Open Access article distributed under the terms of the Creative Commons Attribution Non-Commercial License (http://creativecommons.org/licenses/by-nc/4.0/), which permits non-commercial re-use, distribution, and reproduction in any medium, provided the original work is properly cited. For commercial re-use, please contact journals.permissions@oup.com

