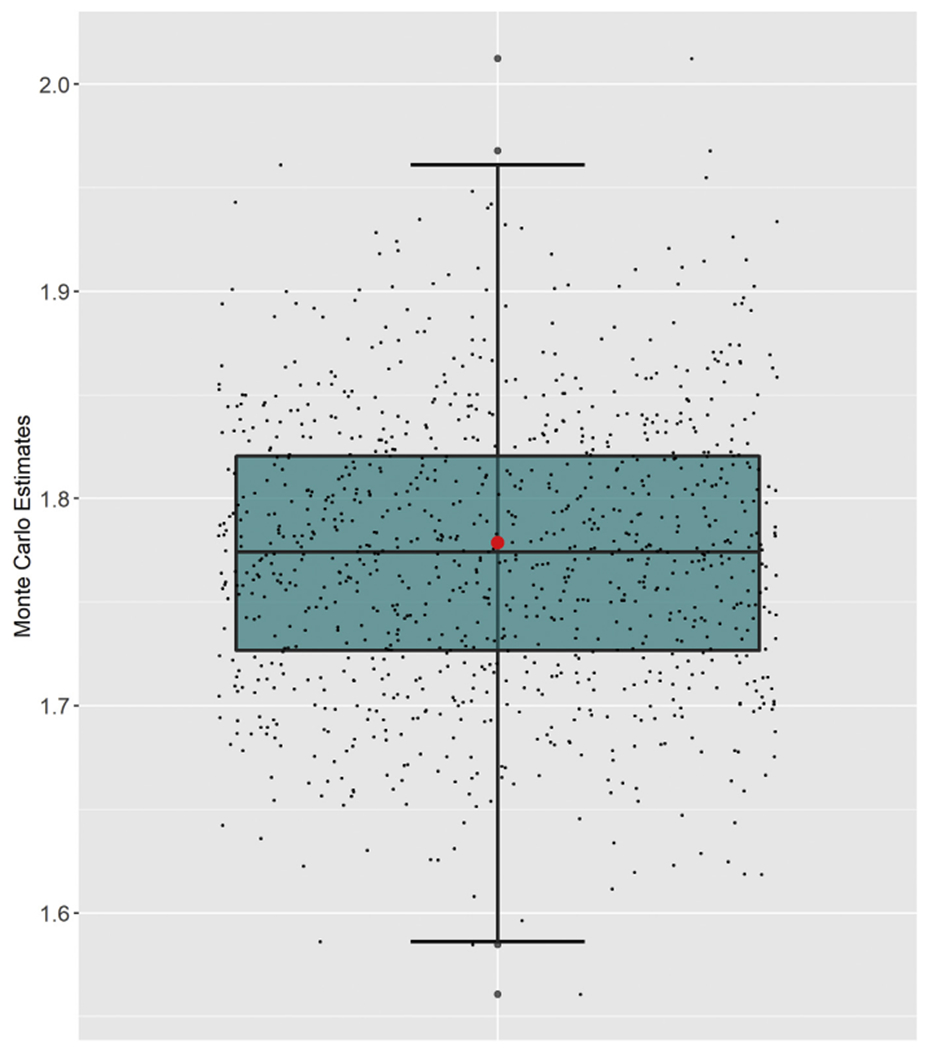
Fig. 1.

Boxplot of the 1000 Monte Carlo estimates of the age-adjusted male-to-female YPLL rate ratio with respect to cumulative COVID-19 deaths in Portugal as of July 30, 2020, accompanied by jittered points denoting the individual Monte Carlo estimates. The red dot represents the estimate obtained from the midpoint method. (For interpretation of the references to color in this figure legend, the reader is referred to the Web version of this article.)
